El Niño and La Niña weather patterns profoundly affect human societies – today, as well as during the past few thousands of years, especially in the Peruvian Andes. Both are part of the climate pattern named the El Niño-Southern Oscillation (ENSO; pronounced “en-so”). Fortunately, scientists can let us know when to expect these changed conditions. Ancient societies did not have access to such useful information. Ritual leaders did the best they could, but offerings of gold and silver, coca leaves, and even sacrifices did not mitigate the floods and droughts that could result from these weather changes.
Centuries ago, the coastal fisherman of Peru gave the warm ocean current that periodically arrives around the time of Christmas the name El Niño, as a reference to “the boy,” or Christ child. El Niño is the warm water phase of ENSO and La Niña, or “the girl,” is the opposite, cool water phase. Changes in ocean surface temperatures are accompanied by modifications in low-level surface winds. As a coupled ocean and atmosphere climate phenomenon, ENSO was first recognized in the 1960s. During an El Niño, the normally east to west winds along the equator weaken or even change direction; during La Niña, the easterly winds become stronger. Dramatic weather changes occur as a result of the ENSO throughout much of the region bordering the Pacific Ocean, especially in tropical latitudes.
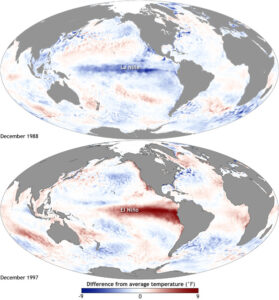
Maps of sea surface temperature anomaly in the Pacific Ocean during a strong La Niña (top, December 1988) and El Niño (bottom, December 1997).
Stormy and Not so Cool: La Niña in 2020-2021
The La Niña currently underway during the fall and winter of 2020-2021 is predicted to last into the spring months. Typical of this climate pattern are reduced tropical cyclones in the Pacific basin and an increase in these storms in the Atlantic basin. And 2020 was definitely a dramatic and record-breaking year. An astounding and highest-on-record 30 named severe storms took place throughout the 2020 season, which officially ended on November 30, 2020. Of these storms, 13 were hurricanes – defined as having wind speeds over 75 mph – with some having maximum sustained winds of 140 to 150 mph. Six hurricanes were ranked as major ones, with each causing losses of over $1 billion. The greatest losses were associated with Hurricane Laura, which struck Louisiana in late August, and caused an estimated $13 billion in damages. An extraordinary 12 named storms made landfall in the US, with every mile along the mainland US Atlantic coast, from Texas to Maine, falling under a tropical cyclone watch or warning in 2020.
In Central America, catastrophic amounts of rainfall and devastating damages occurred during the 2020 storm season – especially in Nicaragua and Honduras. One potential result: caravans of destitute people that may migrate north. (More about this sobering storm season in the J. Masters, 2020, Yale Climate Connections article, below.) Underway in North America: a milder winter over much of the continent, but with increased precipitation in the Pacific Northwest and drier conditions in southwestern states, prolonging the current drought conditions in central and southern California, and in the arid Southwest.
This La Niña is different from the usual. Typically, La Niña years bring cooler temperatures, due to the large amount of cold water exposed across the equatorial Pacific. Sea surface temperatures can drop by about 5 to 9 degrees F. This year, however, except for the cool band across the Pacific, most ocean surface temperatures have been exceptionally warm. Overall, the year 2020 has been sizzling hot, with every month bringing global temperatures close to the hottest months ever recorded – a warming trend clearly tied to human-caused climate change. And even a La Niña phase isn’t keeping things cool.
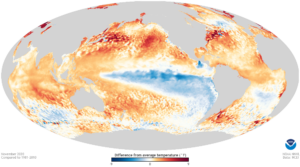
Global sea surface temperature differences from average for November 2020. Red and orange areas were warmer than average, and blue areas were cooler than average. Ocean temperatures in November 2020 were warmer than average across much of the planet except the tropical Pacific Ocean where a La Niña is present.
El Niños and Warm Current Catastrophes in the Peruvian Andes
Offshore from Peru in the central Andes region, a cold ocean current called the Humboldt Current, or Peru Current, holds a dominant role in controlling climate. Despite the tropical latitudes, along the coast the temperature of this current can be as much as 20 degrees F cooler than the more typical warm tropical waters. Originating in the Antarctic region, the cold current flows north along the west coast of South America in a wide band that extends from the shoreline to as much as about 500 miles offshore. The steep western face of the Andes Mountains deflects the strong daily winds blowing inland from the Pacific Ocean. These onshore winds result in upwelling of the cold and nutrient-rich water, bringing it up to the surface and displacing the warm tropical surface water.
For thousands of years the Humboldt Current has influenced the lives of Andean people. The cold water contains a rich soup of nitrogen, phosphorous, potassium, and other elements that are utilized by phytoplankton, the tiny organisms that form a broad base for a prolific food chain ranging from microorganisms to fish, birds and large sea mammals. It is one of the most productive ecosystems found on Earth, and has allowed Andean societies to prosper for millennia. Except, that is, when dramatic changes occur during strong El Niño years.
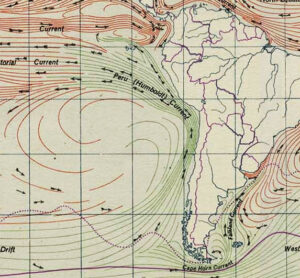
Humbolt Current along the western edge of South America
When El Niño climate patterns are underway, the northeasterly trade winds weaken. Warm water accumulates in the west and central parts of the Pacific Ocean and then flows east along the equator, turning south upon reaching the South American coast and pouring over the top of the cold current. The warm and humid air that results changes the typical weather patterns, and dense rain clouds and thunderstorms develop. Torrential rains batter the lowlands during El Niño weather, while the highlands can be stricken with devastating droughts.
In these changed conditions, fish populations move away from their usual locations or perish. In turn, birds and marine mammals are deprived of food and face starvation. Some warm-adapted tropical fish move southward along the coast to replace the fish species that have died or migrated, but overall, the marine life is significantly reduced.
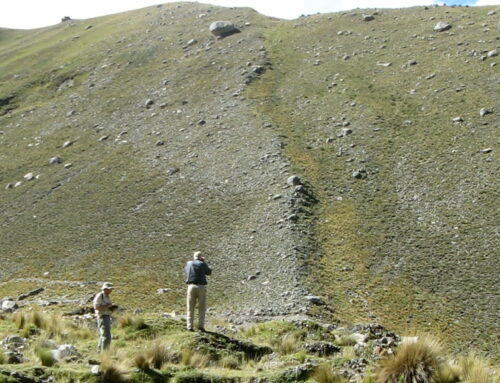
During very strong El Niño events, flooding can be catastrophic in coastal areas of the central Andes. The shape of the landscape can change, especially in the fertile river valleys, depending on variables of plant cover, orientation with respect to storms, and other geographic characteristics. In some areas there are few plants, due to the normally arid coastal climate, and since the soil isn’t stabilized massive mudflows result. Sediment washed down to the coast can form temporary deltas at river mouths. The ocean waves redistribute this material into long ridges of sediment along beaches, covering intertidal zones and smothering all lifeforms.
Not surprisingly, ancient societies faced immense challenges created by El Nino-related diminished marine food supplies along the coast and destruction of fields, irrigation systems, and homes. More about those – as well as ENSO climate changes over time – in Part 2.

SOURCES
Di Liberto, 2020, November 2020: The year is ending as it began, on a hot streak: NOAA – climate.gov, Dec. 15. (https://www.climate.gov/news-features/understanding-climate/november-2020-year-ending-it-began-hot-streak
Masters, J., 2020, A look back at the horrific 2020 Atlantic hurricane season: Yale Climate Connections, Dec. 1. https://yaleclimateconnections.org/2020/12/a-look-back-at-the-horrific-2020-atlantic-hurricane-center/
Maps of sea surface temperature anomaly in the Pacific Ocean during a strong La Niña (top, December 1988) and El Niño (bottom, December 1997). Maps by NOAA Climate.gov. https://www.climate.gov/news-features/blogs/enso/what-el-ni%C3%B1o%E2%80%93southern-oscillation-enso-nutshell
Map of global sea surface temperature differences from average for November 2020. Red and orange areas were warmer than average, and blue areas were cooler than average. Ocean temperatures in November 2020 were warmer than average across much of the planet except the tropical Pacific Ocean where a La Niña is present. Climate.gov image. https://www.climate.gov/news-features/understanding-climate/november-2020-year-ending-it-began-hot-streak
Map of Humboldt Current, US Army image. https://en.wikipedia.org/wiki/Humboldt_Current#/media/File:Humboldt_current.jpg
Photo of seascape – Image by prettysleepy1 from Pixabay — https://pixabay.com/photos/seascape-clouds-storm-horizon-hope-4240264/
If you like my posts, please scroll down to the bottom of this page and leave your email address on my website. You’ll receive messages only when I publish a new post (about once a week) and my occasional newsletter. Join now to learn more about geology, geography, culture, and history.


Great posting! We are so dry in Arizona that fire season will begin 3 months early.
Argh! Same dryness in California. I wrote most of this post in late December — and was wondering if (hoping that!) the Bay Area would have more rain by mid-January — but it hasn’t happened. Glad you liked the post – thanks for the comment!
Geologist, archeologist, now meteorologist… what can’t you do, Roseanne?! Great post.
Thanks Steve! I really enjoy the research — and can write about whatever is most interesting to me, which also hopefully interests my readers!
Please include me in future posts. Thanks for the clear, succinct, and visual writing!
Great! Thanks for the comment, Lee!